Understanding Market Cap in Memecoins: How Valuation Works Across Launchpads
Market capitalization—or market cap—is a vital metric for anyone involved in memecoin trading and investing. However, understanding what market cap actually tells you (and what it doesn’t) is crucial for making informed investment decisions.
What Is Market Cap?
Market cap is calculated as the current token price multiplied by the total circulating supply:
Market Cap = Current Token Price × Circulating Supply
For example, if a memecoin is priced at $0.01 and has 1 billion tokens in circulation, the market cap would be $10 million. However, market cap alone is a misleading safety indicator because it does not account for liquidity—the actual amount of capital available to buy or sell tokens without causing massive price slippage.
The Critical Market Cap Limitation: Liquidity Matters More
Many investors treat market cap as a safety metric, assuming higher market cap = lower risk. This is incorrect.
A token can have a $10 million market cap but only $50,000 in actual liquidity. This means:
- Attempting to sell $100,000 would cause severe price collapse
- Bid-ask spreads become extremely wide
- The token becomes subject to extreme volatility and manipulation
The proper risk metric is the Liquidity-to-Market-Cap Ratio:
- Above 10%: Ideal liquidity-to-market-cap ratio indicating healthy, stable trading
- 5-10%: Adequate but requires monitoring for sudden price moves
- Below 5%: Dangerous—susceptible to sudden collapses and manipulation
This ratio is far more important than market cap alone for assessing actual trading risk.
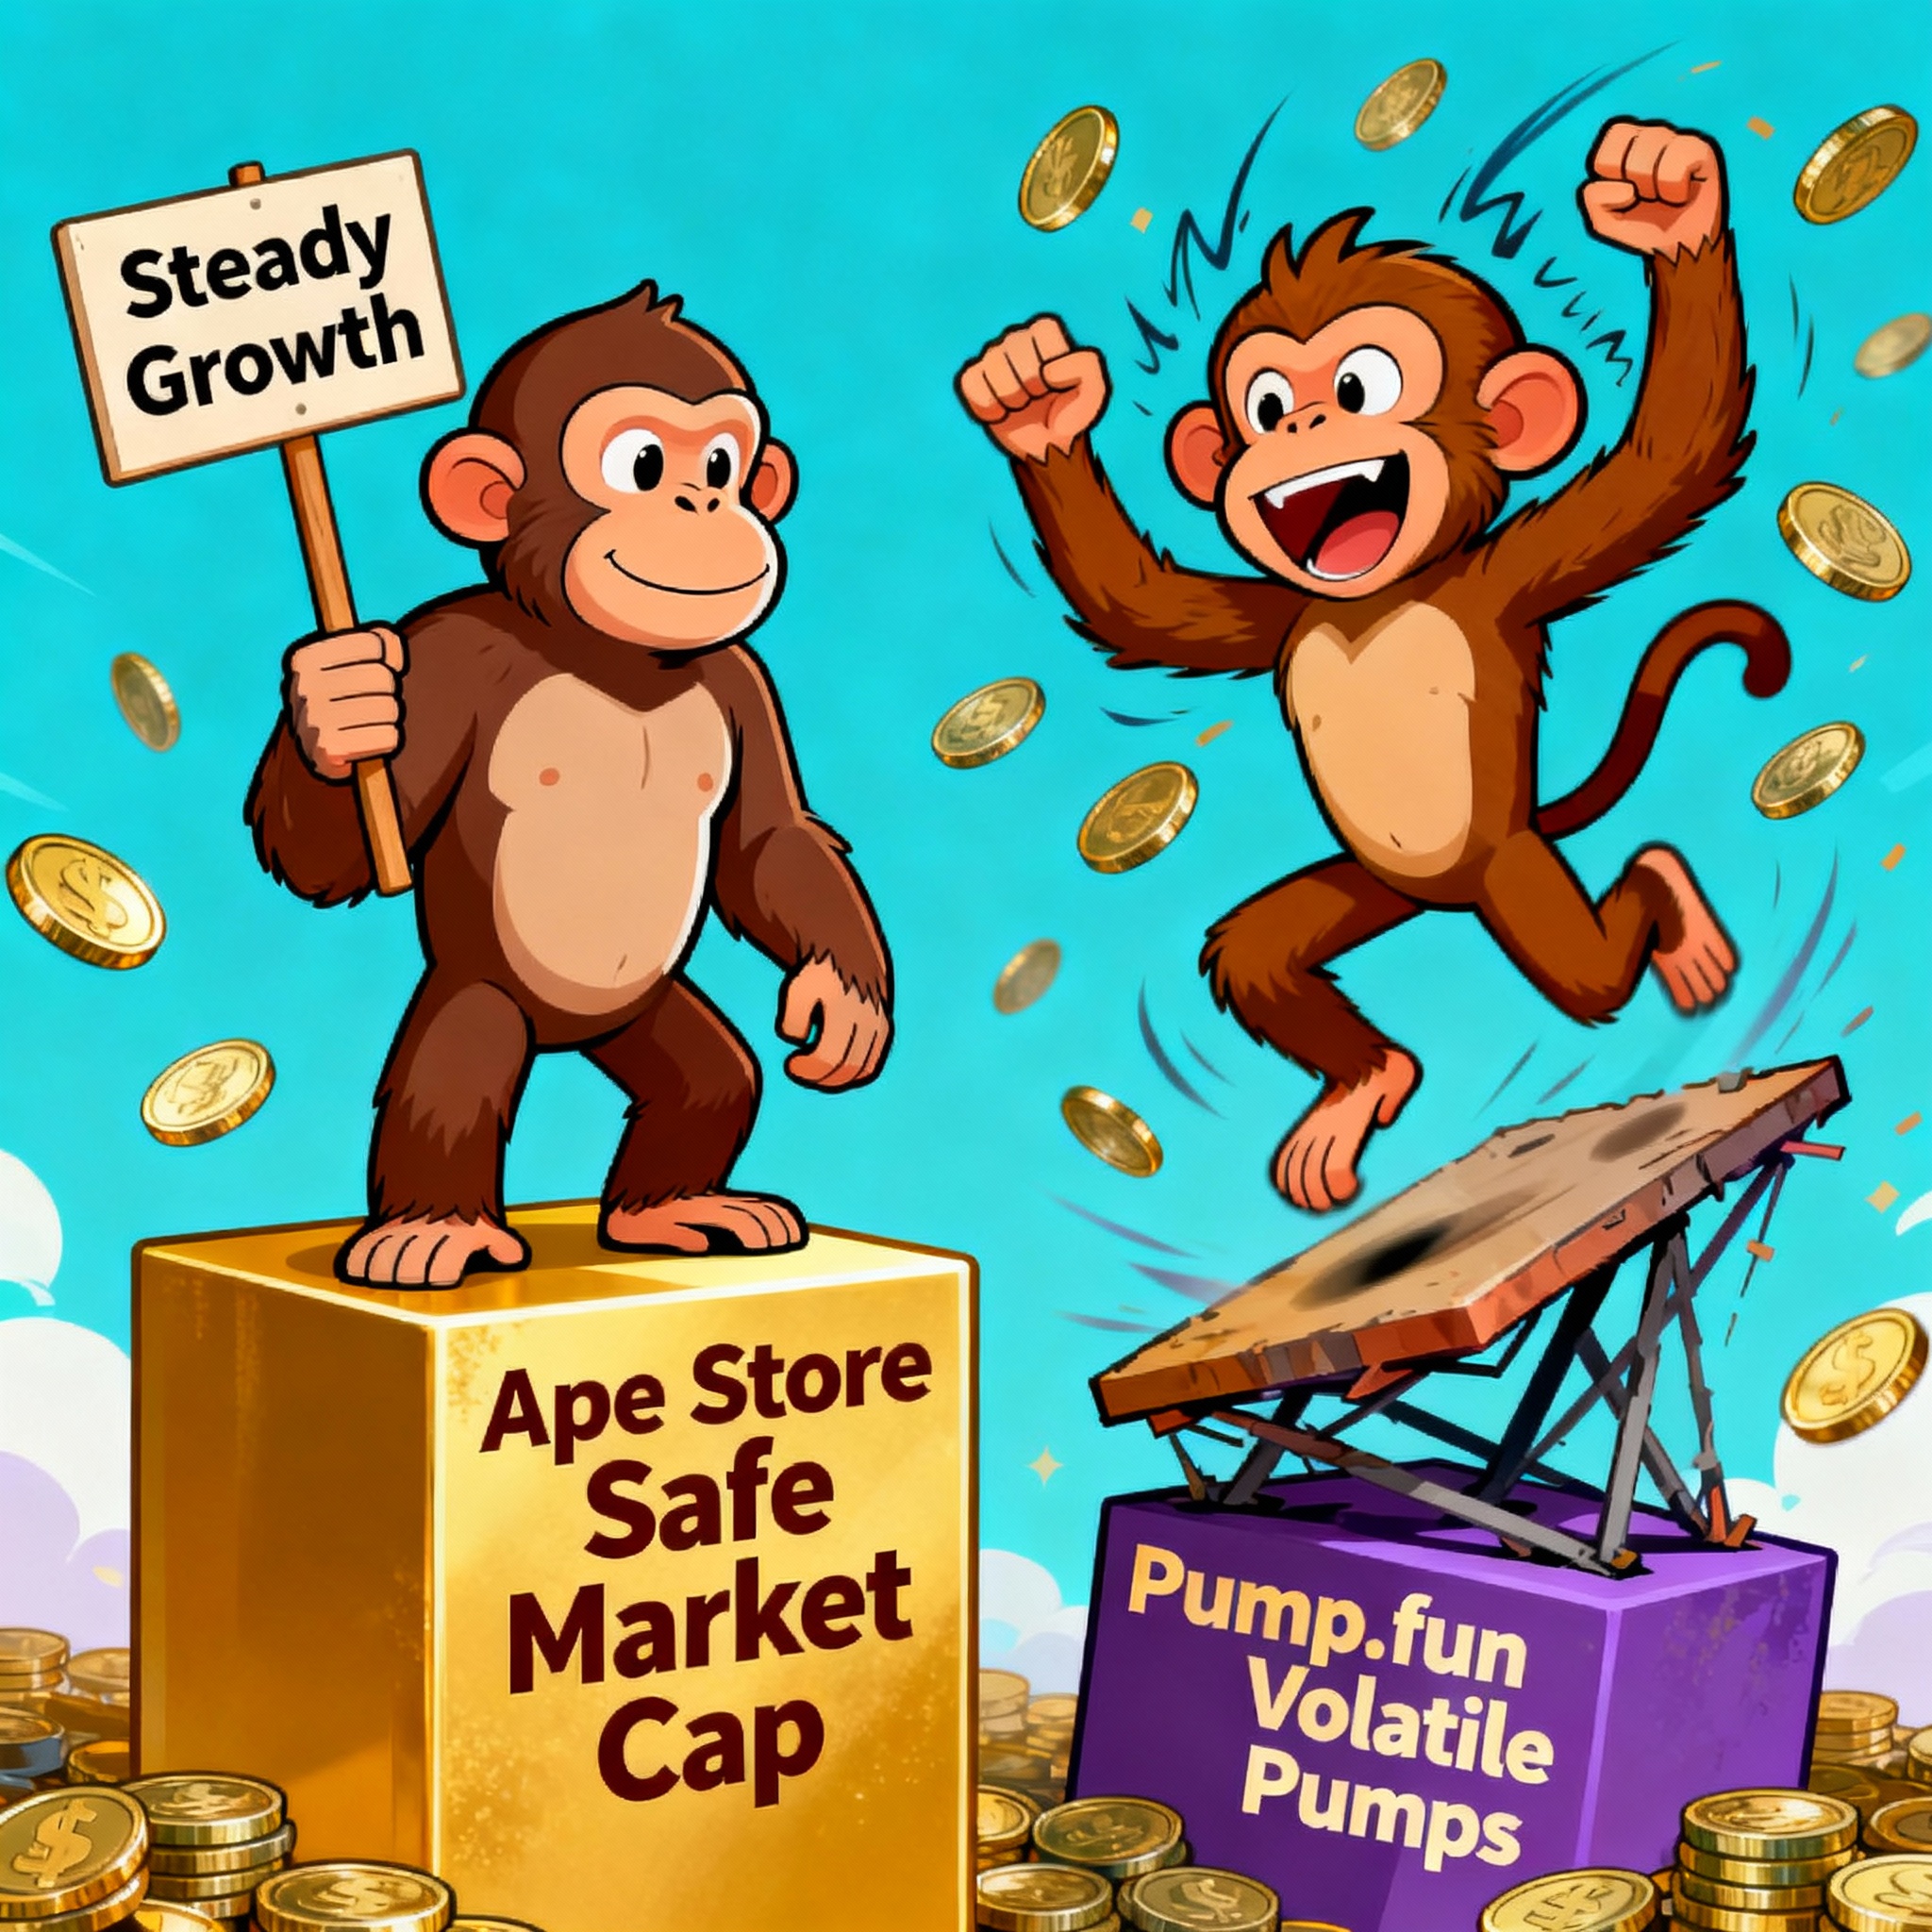
How Pump.fun Structures Market Cap Through Bonding Curves
Pump.fun, the dominant memecoin launchpad with 73.6% market share on Solana (August 2025), uses a sophisticated bonding curve mechanism:
Bonding Curve Mechanics:
- Fixed supply of 1 billion tokens per memecoin
- Pricing formula follows constant product curve: y = 1,073,000,191 – 32,190,005,730/(30+x)
- Where x = SOL purchased and y = tokens obtained
- Initial price is steep (favoring early investors), gradually normalizing as purchases increase
Market Cap Progression:
- Tokens accumulate throughout the bonding curve phase
- When the bonding curve completes (typically at a market cap around $69,000 based on cumulative purchases), 200 million tokens + remaining SOL funds migrate to Raydium (Solana’s DEX) or Pump.fun’s own PumpSwap
- 800 million tokens distribute during bonding curve; 200 million are used to seed initial DEX liquidity
This structure creates predictable price discovery but also enables rapid price swings based on bonding curve mathematics rather than organic supply-demand.
Pump.fun Market Cap Dynamics and Reality
Key Points on Pump.fun Market Caps:
Volatility Through Bonding Curve Design: The steep initial curve incentivizes early purchases but creates accelerating price increases. This algorithmic structure naturally produces high volatility regardless of project fundamentals.
High Failure Rate: Pump.fun has processed over 12 million token launches generating $700M+ in platform revenue (as of August 2025). However, only 97,000 tokens (0.8% success rate) maintain liquidity above $1,000—the rest become illiquid traps.
Scam and Rug Pull Prevalence: The 98.6% failure/scam rate reflects the ease of launching low-quality projects without vetting. Attackers use multiple vectors: honeypot contracts, team dumps, fake partnerships, and coordinate pump-and-dump schemes.
Short-Term Trading Focus: Average memecoin holder duration is just 13.4 days (vs months for Bitcoin/Ethereum), creating intense speculation cycles with frequent liquidations.
Comparing Market Cap Approaches: A Realistic Framework
Rather than claiming one launchpad is “superior,” it’s more honest to acknowledge what actually distinguishes them:
| Aspect | Pump.fun | Typical Alternatives |
|---|---|---|
| Market Cap Mechanism | Defined bonding curve (1B fixed supply) | Varies by platform |
| Liquidity at Launch | Automatic migration to DEX | Variable, often manual |
| Liquidity Ratio | Often <5% (dangerous range) | Varies significantly |
| Platform Dominance | 73.6% market share (Q3 2025) | Fragmented alternatives |
| Token Survival Rate | 0.8% (97k of 12M+ launches) | Comparable or worse |
| Vetting Process | Minimal-to-none (anyone can launch) | Varies by platform |
| Scam/Rug Pull Rate | 98.6% failure rate | Comparable high rates |
Important Caveat: Specific information about Ape.Store’s market cap mechanics, liquidity thresholds, and survival rates is not readily available in public documentation. Comparative claims require verified data sources.
Why Market Cap Alone Doesn’t Determine Safety
Several factors beyond market cap affect memecoin risk:
Token Distribution: Tokens with massive holder concentration (>50% in top wallets) face extreme manipulation risk regardless of market cap.
Liquidity Depth: A $50M market cap token with $200k liquidity behaves differently than a $10M market cap token with $2M liquidity. The second is actually safer despite lower market cap.
Bonding Curve Completion Risk: Tokens completing bonding curves then migrating to DEXs create specific vulnerabilities—initial liquidity providers can dump immediately after listing.
Smart Contract Architecture: Honeypot contracts, paused trading functions, and hidden admin controls can prevent selling despite showing healthy market cap.
FAQ
What does market cap tell me about a memecoin?
Market cap (price × supply) shows token’s total theoretical value and market size. However, it’s a misleading safety metric because it ignores liquidity. A token with $50M market cap but only $50k liquidity is more dangerous than a $10M market cap token with $2M liquidity.
Why is Liquidity-to-Market-Cap ratio more important than market cap alone?
Market cap can be artificially inflated through low liquidity. A high liquidity ratio (>10%) means you can actually buy/sell meaningful amounts without massive slippage. A low ratio (<5%) means the token is fragile and subject to sudden price collapse.
What’s the difference between bonding curves and traditional DEX liquidity?
Bonding curves use mathematical formulas to set prices based on accumulated purchases. Once tokens migrate to DEXs like Uniswap, they use constant-product formulas (x × y = k) where prices fluctuate based on buy/sell orders. Bonding curves are deterministic; DEX pricing is dynamic.
Are higher market cap memecoins always safer?
No. Safety depends on liquidity, holder distribution, contract security, and development activity—not market cap alone. A $100M market cap token with 2% liquidity-to-market-cap ratio is riskier than a $10M market cap token with 15% liquidity ratio.
How many tokens actually succeed after launching on major launchpads?
Data shows approximately 0.8% of tokens launched on leading platforms maintain meaningful liquidity after bonding curve completion. The 98.6% failure/scam rate reflects both low-quality launches and active fraud.
Should I avoid memecoins with low market caps?
Low market cap doesn’t equal bad—high growth potential often appears at smaller caps. However, ensure adequate liquidity, distributed token holdings, and verified contract security. Market cap is one factor among many; never make decisions based on it alone.
Practical Market Cap Evaluation Checklist
Before investing in any memecoin, assess:
- Market cap relative to liquidity – Calculate liquidity/market cap ratio (ideal >10%)
- Holder distribution – Check if whales own >30-40% of supply
- Liquidity lock duration – Verify LP tokens are burned or locked >1 year minimum
- Contract security – Use Token Sniffer, RugDoc, or Honeypot.is for analysis
- Platform track record – Research actual token survival rates, not marketing claims
- Community engagement – Assess social media activity, developer communication
- Realistic price targets – Ignore “10x by next month” promises
Final Thoughts
Market capitalization is a foundational metric for understanding memecoin size and scale, but it’s dangerously misleading as a safety indicator. The relationship between market cap and actual trading risk depends critically on liquidity depth, token distribution, and smart contract security.
When evaluating memecoins across different launchpads, focus on the liquidity-to-market-cap ratio rather than market cap alone. A smaller-market-cap token with healthy liquidity and distributed holdings is objectively safer than a larger-market-cap token with poor liquidity and whale concentration.
Remember: market cap answers “how big is this token?” but liquidity answers “can I actually sell my position?” The second question matters far more for your capital protection.